 |
||||||||
|
||||||||
 |
 |
 |
 |
 |
 |
 |
||


Dear reader, “Big data is like teenage sex: everyone talks about it, nobody really knows how to do it, and everyone thinks everyone else is doing it, so everyone claims they are doing it…” (Dan Ariely). To many of us, big data is a buzz word that has little practical meaning. In this e-update, we will explore what is meant by the term big data and the related concepts of Internet of Things, crowdsourcing and open data. But of course the main question for Mobility Management professionals is how big data can foster a behaviour change and influence transport policies. | |
What is big data? |
|
There is no broadly agreed definition for big data, but generally speaking it is about collecting and storing a huge and fast flow of (real-time) data in many different formats from many different sources, such as cameras, sensors, vehicles, phones, social media, etc. Big data are so large and complex that they cannot be effectively analysed using traditional systems and processes. Not only is the amount and the speed of data flows increasing, but the connections between machines (and between humans and machines) are increasing as the Internet of Things is emerging. For instance, your car could be connected to your calendar and calculate the best route to take to your next meeting. If you get stuck in traffic, it could automatically notify your colleagues or client that you will be late. With the use of big data, cities are evolving towards smart cities. In the field transport this usually means:
All of these applications can help to make transport more sustainable and generate modal shift. But in this e-update we will focus on the question of what we can learn from big data about human behaviour, how this can help us to make better transport policies, and how big data can be used in Mobility Management measures to change behaviour. | |
Big data as a basis for evidence-based policy making |
|
Gathering data about travel behaviour data enables us to understand when, where and how people travel. It plays a critical role in travel trend monitoring, transport planning, and policy decision making. The traditional collection of travel behaviour data involves time-intensive and troublesome processes such as surveys and travel diaries. But today, GPS-based tracking tools as used in smartphone apps enable the collection of an enormous amount of very detailed data without much effort or cost. Let’s look at an example. As there was previously little objective and quantified information about cycling patterns, the Dutch Cyclists’ Union initiated a national monitoring week in 2015 during which over 50,000 people shared information on their cycling habits. These data help Dutch cities to design policies and introduce initiatives that will further improve cycling across the country. The Belgian Region of Flanders followed the example with their own national monitoring week. Another great example is the European Cycling Challenge (ECC). Born from an idea of the city of Bologna as a small pilot with around 70 people, it is now one of the biggest European cycling events. During the 2016 campaign, 52 cities from 17 countries joined the Challenge, and 46,000 people cycled 4,000,000 km in a month. The gamification approach makes bike trips fun: participants track their trips with a free app. They contribute to their team mileage and can check their city’s ranking in real time on a leaderboard. Furthermore, all GPS data collected have a priceless value for city planners. They provide ready-to-use heatmaps; enable deeper analysis on origins/destinations, loss of time at intersections; speeds on cycle lanes and so on. Traffic planners get a whole new set of options to find out about cyclists' real needs. | |
How to use data to foster a behaviour change? |
|
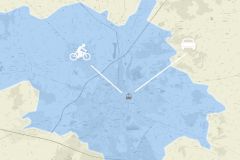
The European Cycling Challenge shows that gathering data blends in very well with awareness raising. The EU-funded TRACE project has assessed the potential of tracking services to promote walking and cycling in cities. They are now developing tracking tools to make walking and cycling campaigns more successful. Sometimes just the visualisation of tracking data can have a great impact on awareness raising. See for instance the example of the M-app campaign in Haasrode, Belgium, where the data clearly showed that during peak hours cycling is faster than car use for 90% of employees. Based on the information collected, applications can also offer travel advice aimed at changing travel behaviour. RouteCoach used trip information and information on the attitudes of participants (measured using a SEGMENT-based questionnaire) to offer personalised travel advice to participants. | |
Crowdsourcing |
|
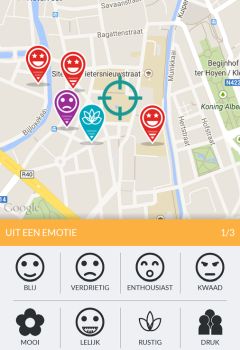
One of the main challenges for using big data is to find a way to process the unstructured heap of information to derive insights that can underpin evidence-based decision making. The next step will be to link automatically generated data with human generated data (through crowdsourcing) to get as much insight as possible. In other words, big data will become smart data. Citizens‘ smartphones cannot only be used for collecting information on travel behaviour, it can also be used to measure noise or other environmental issues or to probe people’s attitudes and context assessment, e.g. how safe they feel in a station. The Routecoach app, for instance, allows users to select the emotion they had during a certain trip. Some routes can be very stressful, but are frequently used because there are no good alternatives. This information does not show in the data that the app collects automatically. Projects that engage citizens in data collection are also called Citizens‘ Observatories. In Flanders, the Flamenco project is developing a platform that allows citizens to create or participate in citizen observatory campaigns. Many other inspiring examples of crowd-sourcing applications can be found in the CIVITAS webinar presentation by Andrew Nash. | |
Big business |
|
Almost all of us are contributing data, often even without knowing it. In the first place, companies use the data they gather to improve their services so that they become more relevant for the user. For instance, when you are using Google Maps or an Android Phone with location services switched on, you are sending data to Google, which they use for displaying the traffic situation on each road in their Google Maps app. Apart from using their users’ personal data to improve their many services, Google also generates income through very targeted advertisements tailored to users’ activities and interests (see Google’s data policy). While Google insists that they do not sell personal data, navigation system companies like TOMTOM and INRIX are collecting unbelievable large amounts of data (every minute hundreds of Millions datasets about cars (speed, location, direction). They use this to provide real-time information on traffic, but they are also processing and selling these data to cities to optimise their traffic systems, and to create analysis tools like the congestion index. Another example is transport networking company Uber. In principle Uber is in many ways a taxi company, without owning a single vehicle. Via the app they collect ride data from all their rides, customers and drivers; control the pricing as well as all payments. They were able to provide a great user experience in the app and to be present in over 500 cities worldwide. They can constantly optimise their offer and adapt to local circumstances – be it the legal framework or the even the weather. This data-driven approach installs what researcher Alex Rosenblatt of New York University calls “algorithmic management”, where drivers can be automatically punished for declining too many ride requests by logging them off from the app for a while (see this article from The Guardian). As the share of mobility-relevant data collected by the private sector is outgrowing that of the public sector, this might imply that in the future most traffic operations and control responsibilities will be outsourced to those that hold the data, according to this ITF report on data-driven transport policy. | |
Big Data – Big Opportunities – Big Questions |
|
It should come as no surprise that concerns about invasion of privacy regularly appear in the media, see for instance these articles about Uber, Android apps, iPhone and Google. In January 2012, the European Commission proposed a comprehensive reform of data protection rules in the EU, that EU Member States have to transpose into their national law by 6 May 2018. This reform should enable citizens to regain control over of their personal data, and simplify the regulatory environment for businesses. The data protection reform is a key enabler of the Digital Single Market which the Commission has prioritised to let our society fully benefit from the digital economy. Meanwhile, the business sector is also starting to embrace the idea that individuals should be in control of their data. This is the key principle behind the ’MyData‘ approach to personal data management. Another major challenge is how to move from data to insight. Cities are investing significant amounts in gathering data, but very often, they may be hoarding data without analysing it, because they are locked into old ways of working with data. Moreover, there is always a bias in location-based data, because they are generated only by those who have access to the data-generating technologies. Some useful information on this topic can be found in the International Transport Forum’s report Big Data and Transport, Understanding and assessing options. | |
Your Data – My Data – Open Data |
|
Open Data are datasets that are freely accessible to everyone and reusable under a minimum number of conditions. For cities, they are a valuable source for solving civic problems, improving transparency and closing the gap between local government and its citizens. Numerous European, national and local projects have been completed in recent years. The best practice cities that are assessed by the European Data Portal in their Analytical Report 4: Open Data in Cities are Amsterdam, Barcelona, Berlin, Copenhagen, London, Paris, Stockholm and Vienna. Transport turns out to be one of the most popular data domains. The development of a city strategy is not common, one of the exceptions being London, which just launched its own Data for London strategy. Open datasets from public bodies across Europe are collected on portals such as the European Data Portal and PublicData.eu. Cities organise numerous events every year as means to raise awareness around Open Data. Hackathons for instance are events during which software developers and subject matter experts collaborate intensively to create new software, e.g. an app, that uses the available open datasets. Sometimes companies also make some of their privately owned datasets available for the event. The event is often focused on a specific theme that is chosen by the municipality, for example culture or transport. Tel Aviv University organised such an Urban Transportation Hackaton in 2014. Another example is HackTrain 3.0, an event that puts 120 developers on moving trains during a whole weekend to come up with the best apps for the railway industry. To learn more about Open Data, explore the links below:
| |
Conclusion |
|
Big data yield many benefits, but cities need a strategy in order not to drown in the huge flow of information. The key is to ask the right questions: what do we need to know and what data do we need to collect in order to answer our questions? Traditional surveys will still be necessary. Big data can tell us where how and when people are going, but so far they cannot tell us why people are doing this – and not all modes and all trips are covered by big data. But one thing is for certain: the importance of monitoring, data analysis and evaluation has not decreased because of big data. To the contrary. | |
Upcoming events |
|
For more events, please visit the EPOMM calendar. | |

 |
 |
 |
 |
 |
 |
 |


